Stochastic Oscillator for Binary Options – Get your XRay Gear on!
Full Review of the Stochastic Oscillator For Binary Options
I want to preface this tool review by saying I use stochastic, it is perhaps my favorite and most indicator and one that I highly recommended for binary traders of all levels. What is stochastic? It is an oscillator that can provide a near x-ray vision on the financial markets. It is based on random walk theory and Brownian Motion, two sophisticated devices that share a lot of concept with Chaos Theories. By definition stochastic, stochastic method and/or stochastic analysis is any type of analytical tool that that incorporates and specifically uses a random variable. In the case of the stochastic oscillator it measures the randomness of day to day market movements over time in order to determine underlying directions.
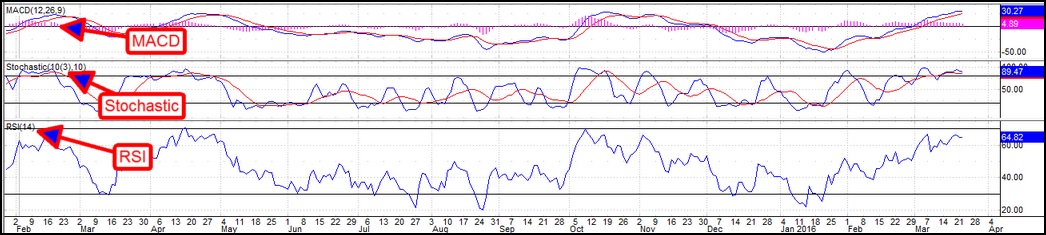
What is an oscillator? An oscillator is a technical analysis tool using a mathematical equation to render into number that range between two extremes, or above and below zero. The numbers are plotted on a graph and then used to make predictions on the health and direction of the market. Other types of oscillators include but are not limited to MACD and RSI. In fact, stochastic can be applied to RSI to make a stochastic analysis of relative strength.
To truly understand how stochastic works think about it like this. A man is walking his dog, the path the dog takes is very random, zigging and zagging in front behind beside the man as he walks. The leash limits the distance the dog can move, creating a seemingly random collection of points that over time track along the direction in which the man is walking. The man may walk in a slightly meandering way because the dog is pulling on the leash but the man is able to keep the dog walking toward the ultimate goal. In this case the dog’s wild zig zag path is the daily movement of the market, affected by news, data and whatever grabs the markets attention. The man is the underlying fundamentals driving the trend. No matter what the market thinks on a day to day basis the underlying trend will keep it moving in the right direction over time. Stochastic measures the random day to day movements and then plots them in a way that reveals the underlying trend of the market.
What is the Stochastic Oscillator
First, the stochastic oscillator is a technical analysis tool that displays as a wave moving between 0 and 100. . Stochastic, from the Greek stochos for random, is an oscillator that incorporates the random element of day to day market fluctuations in order to determine underlying trends. It moves between 0 and 100 with extreme overbought and oversold levels at 20 and 80. The indicator can be used to determine and confirm trends, identify areas of support and resistance and to predict potential reversals among many other things. As an indicator it is useful for newbies and advanced traders alike. The more you use it the more you will see and the more you will like it.

This is how it works; stochastic compares the closing price of a given day to the high and low of a given range, then takes a smoothed version with a moving average and plots the two lines together. What you get is a jagged line that moves over and under a smoother line that is cycling between a high and low extreme. The indicators creator, George C. Lane, said this about the indicator, “doesn’t follow price, it doesn’t follow volume or anything like that. It follows the speed or the momentum of price. As a rule, the momentum changes direction before price.” The calculation is simple and results in two values, %K and %D. The %K is the jagged line, the %D is the smoother line. For %K take the current close – lowest low, then divide by the highest high – lowest low and multiply the whole thing by 100. Then for %D use a 3 day simple moving average of %K. The standard setting, and the one I use, for stochastic is 14 bars. I say bars because stochastic can be used in any time frame so it would be 14 days, weeks, months, hours or minutes as you choose.
- (current closing price – lowest low of 14 periods)/(highest high of 14 periods – lowest low of 14 periods) * 100 = %K
- 3 bar moving average of %K = %D
Signals are given in a variety of ways. The most common are overbought and oversold; when the indicators is moving above the upper signal line it is in overbought condition, if it is moving below the lower signal line it is in oversold condition. Signals are also given on crossovers, crossovers occur whenever %D crosses %K, and whenever either of those two lines crosses above or below the signal lines. Longer term signals are given based on convergence and divergence with asset prices. If stochastic makes a new high while asset prices make a new high that is convergent and indicates higher prices are to come. If asset prices make a new high and stochastic does not that is divergent. Divergences are an indication of weakness and often precede market reversals. We have lots of articles dictating how to trade on the different types of signals given by stochastic, you will find links to those at the bottom of this page.
Why Stochastic Does Not Suck
Stochastic does not suck because it works. The indicator is the most useful oscillator I know next to MACD and one that I use on a daily basis. It is good for trend confirmation through convergence, trend following signals, potential reversal through divergence, overbought/oversold and can also be used to identify support and resistance. It can be used in any time frame and can also be used with multiple time frame analysis to generate even more powerful signals. If there were one tool and one tool only that I would choose this would be it. Of course, using it alongside trend lines, support/resistance lines, Fibonacci Retracements or other form of analysis will only supercharge your results.
Why Stochastic Might Suck
Stochastic might suck because it might make you too excited. I mean, this tool can really do all that I said, it is easy for a newbie or new user of stochastic to jump in and start taking signals at random but be warned. Like any tool it does take some practice to use because like all indicators this one gives off bull and bear signals regardless of the underlying trends. If you just take any old signal without weeding out potential false signals you could get burned.
My Last Words On Stochastic -Recommended to All
Use it. Stochastic is a good tool. Start with the trend following and trend identifying signals, once you have found those you can start looking for confirmations of support/resistance then move on to divergences. All the while keep multiple time frame analysis in mind and never stray from your money management techniques.
Recommended Reading:
- The Geek Simple Stochastic Trend Following Binary Options Strategy
- The Geek Simple Stochastic Trend Following Binary Options Strategy – instructions for using stochastic in a simple, trend following way. Weeds out false signals and enhances returns.
- Using Stochastic For Crossover Signals– discusses the many ways in which stochastic can be used to generate signals through crossovers, including signal line crossovers and %K/%D crossovers.
- Multiple Time Frame Indicators; Stochastic – explains what multiple time frame analysis is, why you should use it, and how to use stochastic in multiple time frames to improve your trading results.
- The Geek’s Stochastic Divergence Strategy – instructions for using stochastic to identify divergences, support/resistance and potential market reversals.
- Full Review Of Divergence Trading – Divergences are a powerful tool, but one not as easy to use as you might think. Bogdan goes into deep detail about how to identify them, and how to use them.
- Stochastic RSI, When Two Worlds Collide – Stochastic RSI uses the stochastic method to study relative strength, two of the most used tools in trading being used together.