TradingView’s Free Charting Package – Review for Binary Options Traders
In Need of a Charting Package? Check Out TradingView!
If you still haven’t found a suitable charting package or you’re the type that likes to asses all there is on the table before you can finally reach a decision, then you have landed in the right place because today I’m gonna tell you all there is to know about the charting package offered by TradingView. Oh… And in case you’ve just discovered that Binary Options are not supposed to be traded based on those silly line charts that your broker offers, and you are wondering what other free options you have regarding charting packages, then you might want to check this review for MetaTrader4 and this review for ChartStation (happy reading!).
What’s the Thing with TradingView?
TradingView Inc. was founded in 2011 and is based in Westerville, Ohio, USA. They offer users, among other things, real-time stocks and currency charts with the possibility of inserting numerous indicators for conducting proper technical analysis. The thing that distinguishes TradingView’s charts from other web-based charting packages is that it’s build in HTML5 which means that it will run just fine on any modern browser, no matter what Operating System you are using. In other words it will run on your tablet, phone, laptop or even Smart TV as long as you have one of these browsers installed: Chrome, Firefox, Safari, Internet Explorer or Microsoft Edge (latest versions are recommended). TradingView’s charts are available in both free and paid subscription plans but today I’m gonna talk only about the free membership features because I think it covers everything you need.
How to Use TradingView’s Charts
First things first: go to their website tradingview.com, click on the Chart tab found on the top side of your window and KABOOM! A chart will pop-up in your face with loads of interactive buttons and choices and messages and… Oh my! When I first came in contact with their charts I thought I would never be able to concentrate and learn how their platform works. But, if you give it a little bit of time and patience you’ll realize that it’s not rocket science and that it works on the same principles as other charting packages out there; it’s just that they wanted to throw all the good stuff into one screen and it got a little bit too crowded (for my liking… at least).
Now let’s see if we can shed some light for you savvy little Binary Options traders on how to work these charts. Easy steps, nothing fancy, just the basics:
1. Sign Up for the FREE account (don’t ask me where it is, it pops up everywhere on TradingView.com). If you don’t take this step your access to their charts will be limited to about 30 minutes or so.
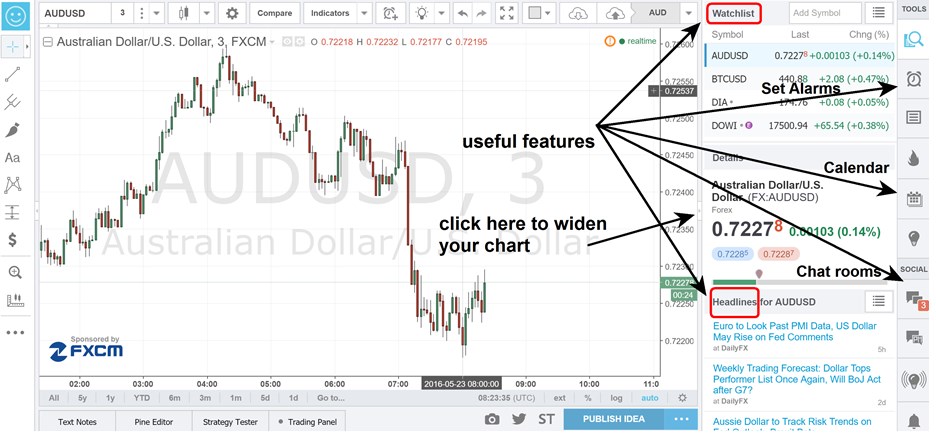
2. Now that you’re logged in, let’s make some sense of what you have on your screen and also do a bit of cleaning up. On the right side you’ll see a vertical window where you can find lots of features like: news feeds, trading alerts, a calendar with upcoming news releases, your list of trade ideas and also social stuff like private messages and chat rooms which you can join (there’s also a room for Binary Options traders). If you collapse this window you’ll have a wider view of your chart.
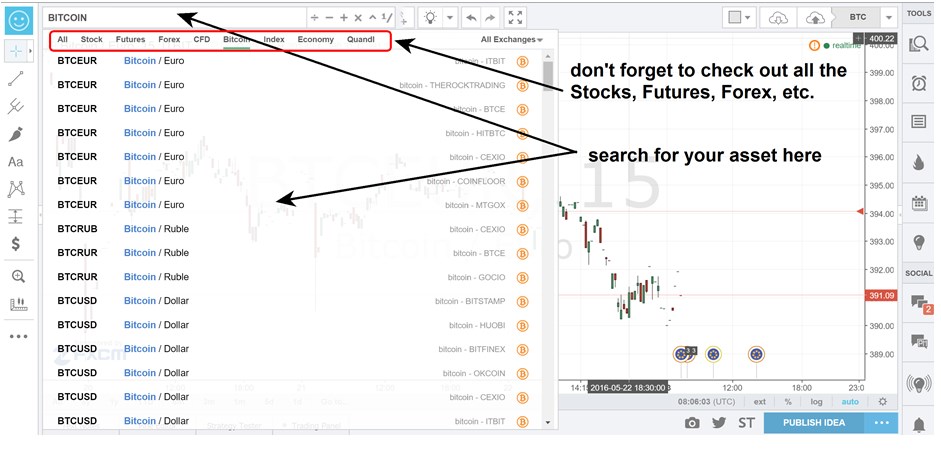
3. Pick your asset. Now let’s say you want to check out Bitcoin/Euro on a 15 minute chart, and plot Stochastic on it (settings 14, 3, 3). You’ll find everything you need above your chart; click in the first tab, write BITCOIN and a drop list will appear (that drop list is huge, you can take your time and see what else they have).
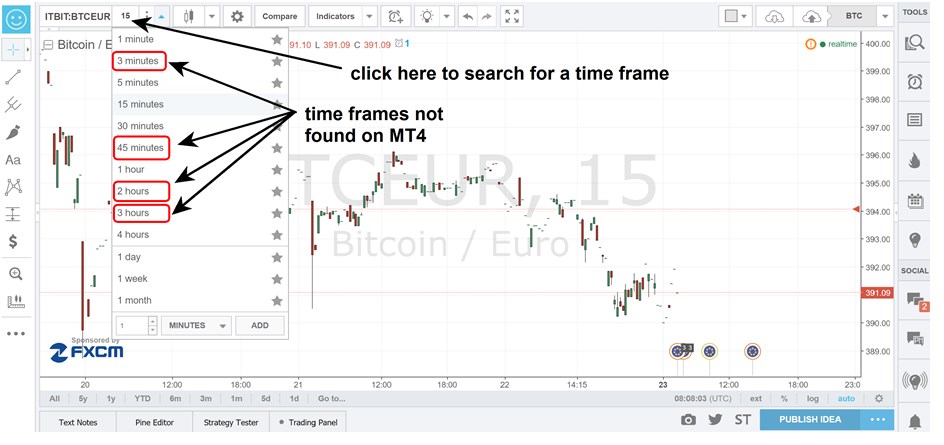
4. Pick your chart time frame. On the next tab you can change the chart’s time frame from one minute to one month; note that you can create a custom interval only if you subscribe to their PRO service (paid subscription), but for the free accounts they offer a decent variety, way more than MT4 does.
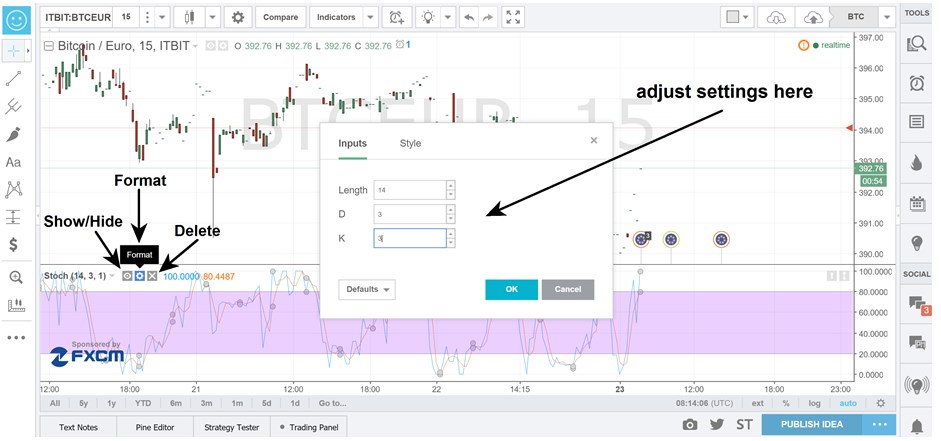
5. Add an indicator. Next, click on the Indicators tab and a window will pop-up. Now, all you common indicators will be under Built-ins, but be sure that you check all the goodies like other indicators build by fellow users (in Public Library). OK, so let’s focus on our Stochastic, you’ll find it in the Built-in list.
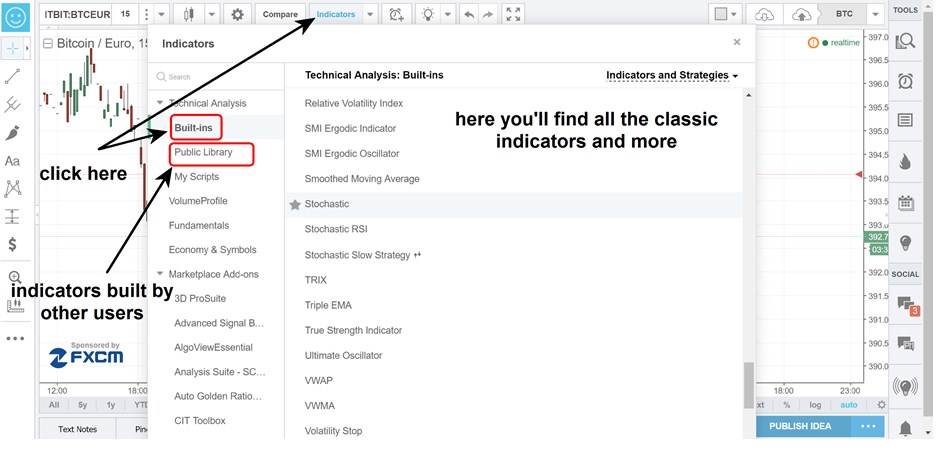
You first need to add it to your chart and after this step you can change its settings by clicking on the small Format icon which is located on the left corner of the indicator’s window.
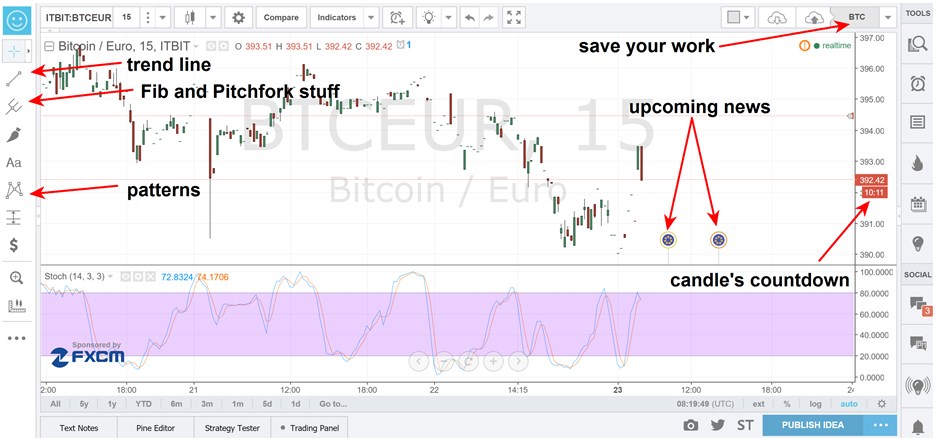
If you want to add trend lines, Fib levels or a text you’ll find all of these on the left part of you chart. Don’t forget to save your work so that you can access it anytime, anywhere and on any device.
Please take your time and push all those buttons (they are many… I know) because it’s a good way to discover what’s available in the free subscription and what features will require you to reach for the wallet.
Why TradingView’s Charts Don’t Suck?
First of all they offer a free subscription, so what’s not to like? Other things that I like are: the wide variety of custom indicators build by other users (you never know when you might find the Holy Grail of indicators), the news calendar which is brilliantly displayed on your chart’s timeline, thus you’ll never be caught off guard by news releases. The Headlines section is also a great feature because it only provides news feeds regarding the asset that you’re watching, not bombarding you with news that you are not interested in.
Why TradingView’s Charts Suck?
My biggest disappointment is that with the free subscription you cannot create a multiple chart layout, meaning that you can only have one chart on each tab. You can open multiple tabs and have on each a different asset but then using the full screen mode is a pain in the a$$. Every time you wanna see a different chart you have to exit full screen mode, switch the tab and enter full screen mode again. Imagine doing this for 10 different assets.
Is TradingView Better Than Other Charting Packages?
To be honest, my answer is: Not really! I mean, I like many of its features but it doesn’t make me want to switch from my MT4 account. You can call me old fashioned but I’m used with it and I also like the fact that a huge number of coders use MQL4 language, and you know me… I’m always searching for the Holy Grail. Despite my personal preference, I encourage you to check out TradingView’s charting package because I have a feeling that many of you will find interesting stuff to play around with.